What Many Automated Greenhouses Overlook in Climate Control for Peak Yields
Automated Greenhouse Climate Control is often described as a problem of measuring temperature, humidity, light, and CO2, then letting software adjust fans, vents, heating, cooling, shade, or enrichment. The harder problem is deciding whether those measurements actually describe the environment experienced by the crop. A greenhouse can have a perfectly functioning controller and still make poor decisions if its sensors sit in unrepresentative locations, if the data are interpreted without crop physiology, or if several actuators are fighting one another.
That distinction matters most when the goal is not simply to keep the room within a numerical range, but to create a stable crop-zone environment that supports photosynthesis, transpiration, pollination, disease avoidance, and predictable development. Research on greenhouse microclimates repeatedly shows that conditions vary through space and time. The practical lesson is straightforward: automation is only as intelligent as the environmental picture it receives.
At a Glance: The Five Signals That Matter
- Location: A sensor should represent the crop zone or deliberately monitor a known problem area.
- Time: A noon reading can mean something very different from a pre-dawn reading.
- Relationships: Temperature, relative humidity, light, CO2, and airflow interact rather than behaving as independent variables.
- Plant response: The objective is a useful physiological environment, not merely a compliant dashboard.
- Control logic: Heating, ventilation, cooling, shade, humidity control, and CO2 enrichment can produce competing effects.
The fastest diagnostic question is therefore not “Are the sensors working?” It is “Would these readings change if the plants were moved to the hottest, wettest, brightest, or least ventilated part of the house?” If the answer is yes, a single central reading may be hiding the condition that matters.
Why One Good Sensor Can Still Give Bad Control
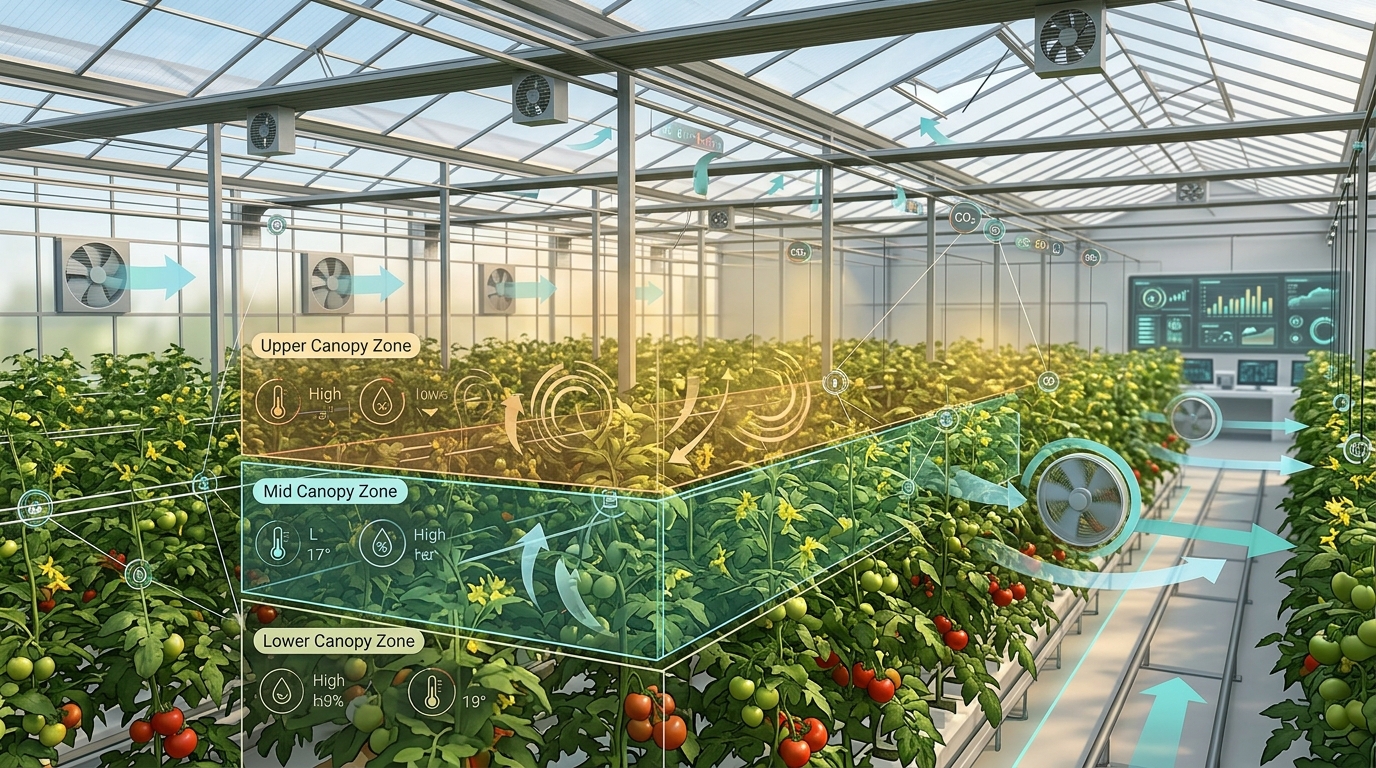
Sensor accuracy and sensor representativeness are different qualities. A calibrated temperature probe can report its own location accurately while still giving the controller a misleading picture of the crop environment. Greenhouses develop gradients because sunlight, glazing, crop density, ventilation openings, fans, heating equipment, cooling systems, and outside weather do not affect every point equally.
Recent experimental work has shown that temperature differences inside a greenhouse can become large enough to affect calculations based on accumulated temperature. A 2026 study of tomato cultivation found substantial spatial temperature variation and demonstrated that sensor position could influence estimates used for crop modeling. Earlier work likewise evaluated sensor locations according to whether they represented the overall environment or identified areas with unusually large variation.
This creates an important distinction between two kinds of measurement. A representative sensor is intended to approximate the environment of a defined production zone. A diagnostic sensor is intentionally placed where problems are likely: near a hot wall, close to a ventilation boundary, near a cooling pad, or in a dense canopy. Representative sensors and diagnostic sensors serve different jobs.
Trying to make one sensor perform both jobs can create confusing automation. If it is placed in the most extreme location, the entire greenhouse may be controlled around an unusually hot or wet pocket. If it is placed in a quiet central location, the controller may miss a damaging edge condition.
Sensor Placement Should Follow Airflow and Crop Geometry
“Put the sensor in the center” is easy to implement, but it is not a universal greenhouse rule. The appropriate location depends on the greenhouse geometry, crop height, ventilation arrangement, heating and cooling equipment, and the purpose of the measurement.
For temperature and humidity, the crop canopy deserves particular attention because plants experience conditions at that scale. A wall-mounted sensor high above the crop can measure a different thermal and humidity environment from leaves near the canopy. Likewise, a sensor directly in a strong fan stream may measure an artificially mixed pocket that is not representative of the broader crop zone.
The same logic applies horizontally. Cooling pads, exhaust fans, vents, doors, exterior walls, and sunny roof sections can create distinct microclimates. In a multi-span structure, one sensor per greenhouse may be insufficient if the spans have different exposure or airflow patterns.
A useful practical rule is to map the greenhouse before deciding that a sensor network is “complete.” Identify the crop canopy, incoming air, outgoing air, heating sources, cooling sources, major shade boundaries, and areas where condensation has occurred. If those zones behave differently, the sensing strategy should acknowledge that difference.
Temperature and Relative Humidity Are Not the Whole Story
Relative humidity is easy to display, but it can be misleading when interpreted without temperature. Relative humidity changes as air temperature changes even when the amount of water vapor remains similar. That means a controller responding to RH alone can sometimes chase a moving target.
This is where vapor pressure deficit, or VPD, becomes useful. VPD expresses the drying power of the air relative to the moisture-holding capacity of air at the relevant temperature. In crop production, it provides a more physiologically meaningful way to think about the interaction between temperature and humidity. The appropriate VPD range is crop- and development-dependent, so there is no single universal number that should be applied to every greenhouse.
VPD connects temperature and humidity to plant water relations. That makes it particularly useful for interpreting situations in which RH looks acceptable but the plant response does not. A rapid temperature increase can change VPD considerably without a dramatic change in the RH percentage shown on a dashboard.
VPD also illustrates why climate automation should not be built around isolated thresholds. If a controller cools aggressively to reduce temperature, it may alter RH and VPD. If ventilation removes humid air, it may also remove CO2. If heating is used to lower RH, the energy cost and resulting plant temperature need to be considered. The variables are coupled.
Light, CO2, and Temperature Form a Physiological System
Plants do not respond to temperature in isolation. Photosynthesis depends on light, carbon dioxide availability, water status, temperature, and the physiological condition of the plant. Consequently, an automated system that optimizes one environmental number without checking the others can create an apparently precise but biologically incomplete control strategy.
CO2 is an especially useful example. During active photosynthesis, plants consume CO2. A tightly closed greenhouse can therefore experience a substantial daytime decline in CO2 even while temperature and humidity remain within their configured ranges. Opening vents to cool the greenhouse can restore air exchange while simultaneously making elevated CO2 more difficult to maintain.
Oklahoma State University Extension notes that CO2 response interacts with light, temperature, water, and nutrition. That relationship means a CO2 reading should not be treated as an isolated “higher is better” target. The crop has to have sufficient light and appropriate temperature and water conditions for additional CO2 to contribute meaningfully to the production system.
CO2 is a physiological input, not merely another sensor reading. The same principle applies to light. A temperature reading taken under intense solar radiation may represent a very different plant environment from the same air temperature under low light. If the greenhouse uses supplemental LEDs, shade curtains, or dynamic shading, those operating states should become part of the data interpretation.
Airflow Changes the Climate That Plants Actually Experience
Fans and vents do more than move air from one place to another. They change temperature gradients, humidity distribution, boundary layers around leaves, and the rate at which outside air mixes with greenhouse air. Airflow changes the climate that plants actually experience.
That is why a controller should be evaluated not only by its setpoints but by its response to actuator combinations. Consider a warm, humid afternoon. Opening vents may lower temperature and humidity, but if outside air is already humid, the humidity reduction may be limited. Turning on circulation fans can improve mixing without necessarily removing moisture. Increasing exhaust can change the pressure and airflow pattern through the structure. Shading can reduce solar heat load but also change available light for photosynthesis.
The correct response therefore depends on the source of the problem. If the issue is a hot pocket caused by solar load, shade may address the cause more directly than simply increasing ventilation. If the problem is stagnant humid air around dense foliage, better circulation and appropriate dehumidification may matter more than lowering the whole-house temperature.
Studies of multi-span greenhouses have found that ventilation conditions and crop height influence temperature and humidity distributions. This is another reason to avoid assuming that an actuator has the same effect everywhere in a large structure.
Advanced Data Interpretation Beats More Dashboard Gauges
Adding sensors creates more data, but not automatically more understanding. A useful climate-control system needs a way to turn measurements into patterns, exceptions, and decisions.
Start by examining data in three dimensions: where it was measured, when it occurred, and what the greenhouse was doing at that moment. The third dimension is frequently overlooked. A temperature spike while a vent is closed means something different from a spike while exhaust fans are operating. A CO2 decline during heavy ventilation is not necessarily a sensor fault. A humidity increase after irrigation may be expected, while the same increase several hours later may indicate poor drying or inadequate air exchange.
Time-of-day analysis is particularly valuable. USDA Agricultural Research Service work on greenhouse sensing found meaningful variation across both physical locations and times of day. This means a simple daily average can erase precisely the peaks and transitions that matter to plant stress and disease risk.
Instead of asking only whether the average temperature was acceptable, inspect questions such as:
- How often did the canopy cross the intended temperature band?
- How long did high-humidity conditions persist near dawn?
- Did one zone repeatedly diverge from the others?
- Did the divergence appear only during high solar radiation?
- Did ventilation changes create unexpected humidity or CO2 responses?
- Did the same anomaly appear across multiple independent sensors?
This approach also improves fault detection. A single sensor that suddenly differs from neighboring sensors may have a problem. Several sensors changing together immediately after an actuator event are more likely to be showing a real environmental response.
The Key Comparison: What the Controller Sees vs. What the Crop Needs
The table highlights a recurring theme: the limitation is often not the sensor itself. It is the gap between a measurement and the biological question the controller is supposed to answer.
What to Do Now: A Fast Climate-Control Audit
For growers reviewing an existing automated greenhouse, the quickest improvement may be an audit rather than another automation feature. The goal is to identify whether the current system can distinguish a normal condition from a localized problem.
- Map the crop zone. Mark the typical canopy height, dense foliage, edges, corners, vents, fans, heating sources, cooling equipment, and major solar-exposure differences.
- Compare at least two locations. If only one environmental sensor exists, temporarily compare its readings with a second measurement point during representative operating conditions.
- Check dawn, midday, and evening. These transitions often expose humidity accumulation, solar heating, or ventilation changes that a daily average conceals.
- Record actuator state. Log whether fans, vents, heaters, cooling, shade, lighting, or CO2 systems were active when the climate changed.
- Calculate or monitor VPD. Use temperature and humidity together rather than treating RH as an independent plant-health signal.
- Inspect CO2 alongside ventilation and light. A CO2 decline during aggressive air exchange may be a predictable system response rather than a mysterious anomaly.
- Look for persistent spatial differences. A recurring hot or humid zone deserves investigation before simply widening the whole-house setpoint.
- Validate suspicious readings. When one sensor disagrees sharply with neighboring observations, check the sensor, shielding, placement, calibration status, and local airflow before changing the control algorithm.
When to Add Sensors—and When Not To
More sensors are useful when they answer a specific unresolved question. They are less useful when they merely duplicate measurements without changing interpretation or control.
If a greenhouse has a known temperature gradient between the inlet and exhaust sides, additional spatial measurements can help characterize that gradient. If the problem is uncertainty about overnight humidity, time-resolved humidity and temperature data near the crop canopy may be more valuable than additional daytime temperature sensors. If CO2 enrichment is being evaluated, measurements should be interpreted in relation to ventilation and light rather than treated as a standalone optimization target.
Research has also explored data-driven methods for selecting sensor locations. Studies using clustering and other analytical approaches demonstrate that a carefully selected subset of locations can sometimes capture much of the environmental variation found in a larger sensor network. The broader lesson is not that every greenhouse needs a particular number of sensors. It is that sensor quantity should follow the spatial variability and control question.
If the greenhouse is small, relatively uniform, and manually inspected often, a modest sensor network may be sufficient. If the greenhouse is large, multi-span, densely planted, or highly automated, the case for distributed monitoring becomes stronger. The decision should follow variability, not an arbitrary sensor count.
Warning: Tight Control Can Increase Energy Use Without Improving Yield
Warning: A narrower environmental setpoint is not automatically a better setpoint. More aggressive heating, cooling, ventilation, or dehumidification can consume substantially more energy and may cause competing environmental changes.
Climate-control precision should therefore be judged against the crop response and production objective. A controller that constantly corrects tiny deviations may look sophisticated while increasing actuator cycling, energy use, equipment wear, or unwanted interactions. The appropriate tolerance depends on crop, growth stage, weather, greenhouse design, and control objective.
A 2026 study of an automated greenhouse control prototype illustrates this trade-off: a narrower temperature control range required substantially more energy than a wider range in the tested system. That result does not establish a universal temperature band for every crop or greenhouse. It does demonstrate why “tighter” should not be treated as synonymous with “better.”
Humidity Is Also a Disease-Management Decision
Climate control affects more than growth rate. Persistent humid conditions, poor circulation, and condensation can increase the environmental conditions favorable to some diseases. Penn State Extension specifically identifies air circulation, ventilation, and humidity reduction as important considerations in greenhouse disease management.
This creates a useful counterexample to temperature-first automation. Suppose the air temperature is comfortable but the crop remains wet or condensation repeatedly forms around the canopy. Increasing the temperature slightly may not solve the underlying air-movement problem. Conversely, aggressive ventilation may lower humidity but also reduce CO2 concentration during photosynthetically active periods.
The better question is therefore: What physical process is creating the unwanted condition? If the cause is condensation, examine dew point and cold surfaces. If it is stagnant air, examine circulation. If it is excessive moisture input, inspect irrigation and drying time. If it is outside-air humidity, recognize that ventilation may have limited dehumidifying value.
Common Automation Mistakes That Look Reasonable
- Using the greenhouse center as the automatic truth. The center may be representative in one structure and misleading in another.
- Mounting sensors where they are convenient to service. Convenience is not the same as crop representativeness.
- Reacting to RH without temperature. Relative humidity is inherently temperature-dependent.
- Optimizing CO2 without considering ventilation. A controller cannot maintain an elevated concentration indefinitely while simultaneously exchanging large volumes of outside air.
- Using daily averages to diagnose short stress events. Averages can conceal dawn humidity spikes or midday thermal peaks.
- Adding sensors without defining their purpose. Every sensor should have a monitoring, diagnostic, validation, or control role.
- Letting actuators compete. Heating while simultaneously ventilating, for example, can sometimes represent a deliberate humidity-control strategy, but it should be an explicit control decision rather than an accidental loop.
FAQ: Automated Greenhouse Climate Control
1. Where should greenhouse temperature sensors be placed?
There is no universal single location. Placement should reflect the crop canopy, airflow pattern, greenhouse geometry, and purpose of the measurement. A representative sensor and a diagnostic sensor may intentionally occupy different locations.
2. Is relative humidity enough for automated greenhouse control?
Usually, RH is more informative when interpreted with temperature. VPD, dew point, and temperature trends can provide additional context about plant water relations and condensation risk. The exact control metric should reflect the crop and production objective.
3. Why does canopy height matter?
The plant canopy can experience a different temperature, humidity, and airflow environment from the general greenhouse air. Crop height, density, radiation, and ventilation can all influence that microclimate.
4. Should every greenhouse use CO2 enrichment?
No. The value of supplemental CO2 depends on the crop, light availability, greenhouse operating state, ventilation, temperature, water, nutrition, and production goals. CO2 should be evaluated as part of the whole physiological system.
5. How can sensor data reveal a bad sensor?
Compare the suspicious reading with nearby sensors, time-of-day patterns, actuator events, and independent measurements. A sudden isolated divergence is more suspicious than a coordinated change across several sensors after a known environmental event.
6. Does adding more sensors always improve climate control?
No. More measurements can add value when they reveal spatial or temporal variation that affects decisions. They can also create unnecessary complexity when measurements are redundant or are not connected to a defined control or diagnostic question.
7. Why can a greenhouse have acceptable temperature but poor crop performance?
Temperature is only one part of the plant environment. Light, CO2, water availability, humidity, VPD, airflow, root-zone conditions, crop load, and disease pressure can all affect physiological performance and yield.
8. What should be checked before changing climate setpoints?
First verify the sensor location and condition, then examine spatial and time-based trends, actuator states, ventilation, light, humidity, and CO2. A persistent problem should be traced to its physical cause before simply moving a numerical target.
Information Synthesis: Build the Control System Around the Crop Zone
The most important overlooked feature of automated greenhouse climate control is not another actuator or another dashboard tile. It is the connection between where the data come from, how those data change, and what the plant is likely experiencing.
Sensor placement establishes whether the measurements are representative. Time-series analysis reveals whether the problem occurs at dawn, midday, night, or during a particular operating state. VPD adds physiological context to temperature and humidity. CO2 becomes more meaningful when interpreted alongside light and ventilation. Airflow analysis explains why two locations can behave differently. Disease considerations add another reason to manage humidity and condensation carefully.
The practical sequence is therefore simple: map the microclimate, validate the measurements, interpret relationships, then automate the response. If conditions are spatially uniform, a simpler network may be entirely appropriate. If the greenhouse contains strong gradients, dense crops, multiple spans, or complex actuator interactions, distributed sensing and more deliberate data analysis become increasingly important.
Peak yield is ultimately a biological outcome, while automation works with measurements and control actions. The strongest systems bridge those two worlds instead of assuming that a stable number on a screen means a stable environment around every leaf. When climate data are designed around the crop's actual microclimate, automation has a much better foundation for improving consistency, resource efficiency, and production quality.


Comments
Post a Comment